Electricity Maps calculates the carbon intensity of electricity consumption to optimize usage at scale
May 7, 2024
Romain Dillet
If you’re an electricity nerd, chances are you’ve already spent quite a few hours looking at Electricity Maps and its mesmerizing export flow animations. This open source data visualization project has been around since 2016. But companies like Google and Samsung are increasingly relying on this rich dataset to hit their sustainability goals and empower their own users.
There are currently 20 people working for Electricity Maps and the company has been profitable for a few years. But TechCrunch has exclusively learned it recently raised a $5.4 million (€5 million) funding round from Transition and Revent, to take things up a notch by investing in the product and the business. Electricity Maps is now both a data visualization tool and an enterprise API for data-driven decarbonization — and one wouldn’t work without the other.
Founded by Olivier Corradi, a French and Danish entrepreneur and data scientist who previously worked for voice assistant startup Snips, Electricity Maps started from an itch to know more about electricity production and consumption. “There were articles in the press saying that Denmark ran on 100% renewable energy for a day. So I was wondering whether this was true and how long it lasted — how many hours in the day,” Corradi told TechCrunch.

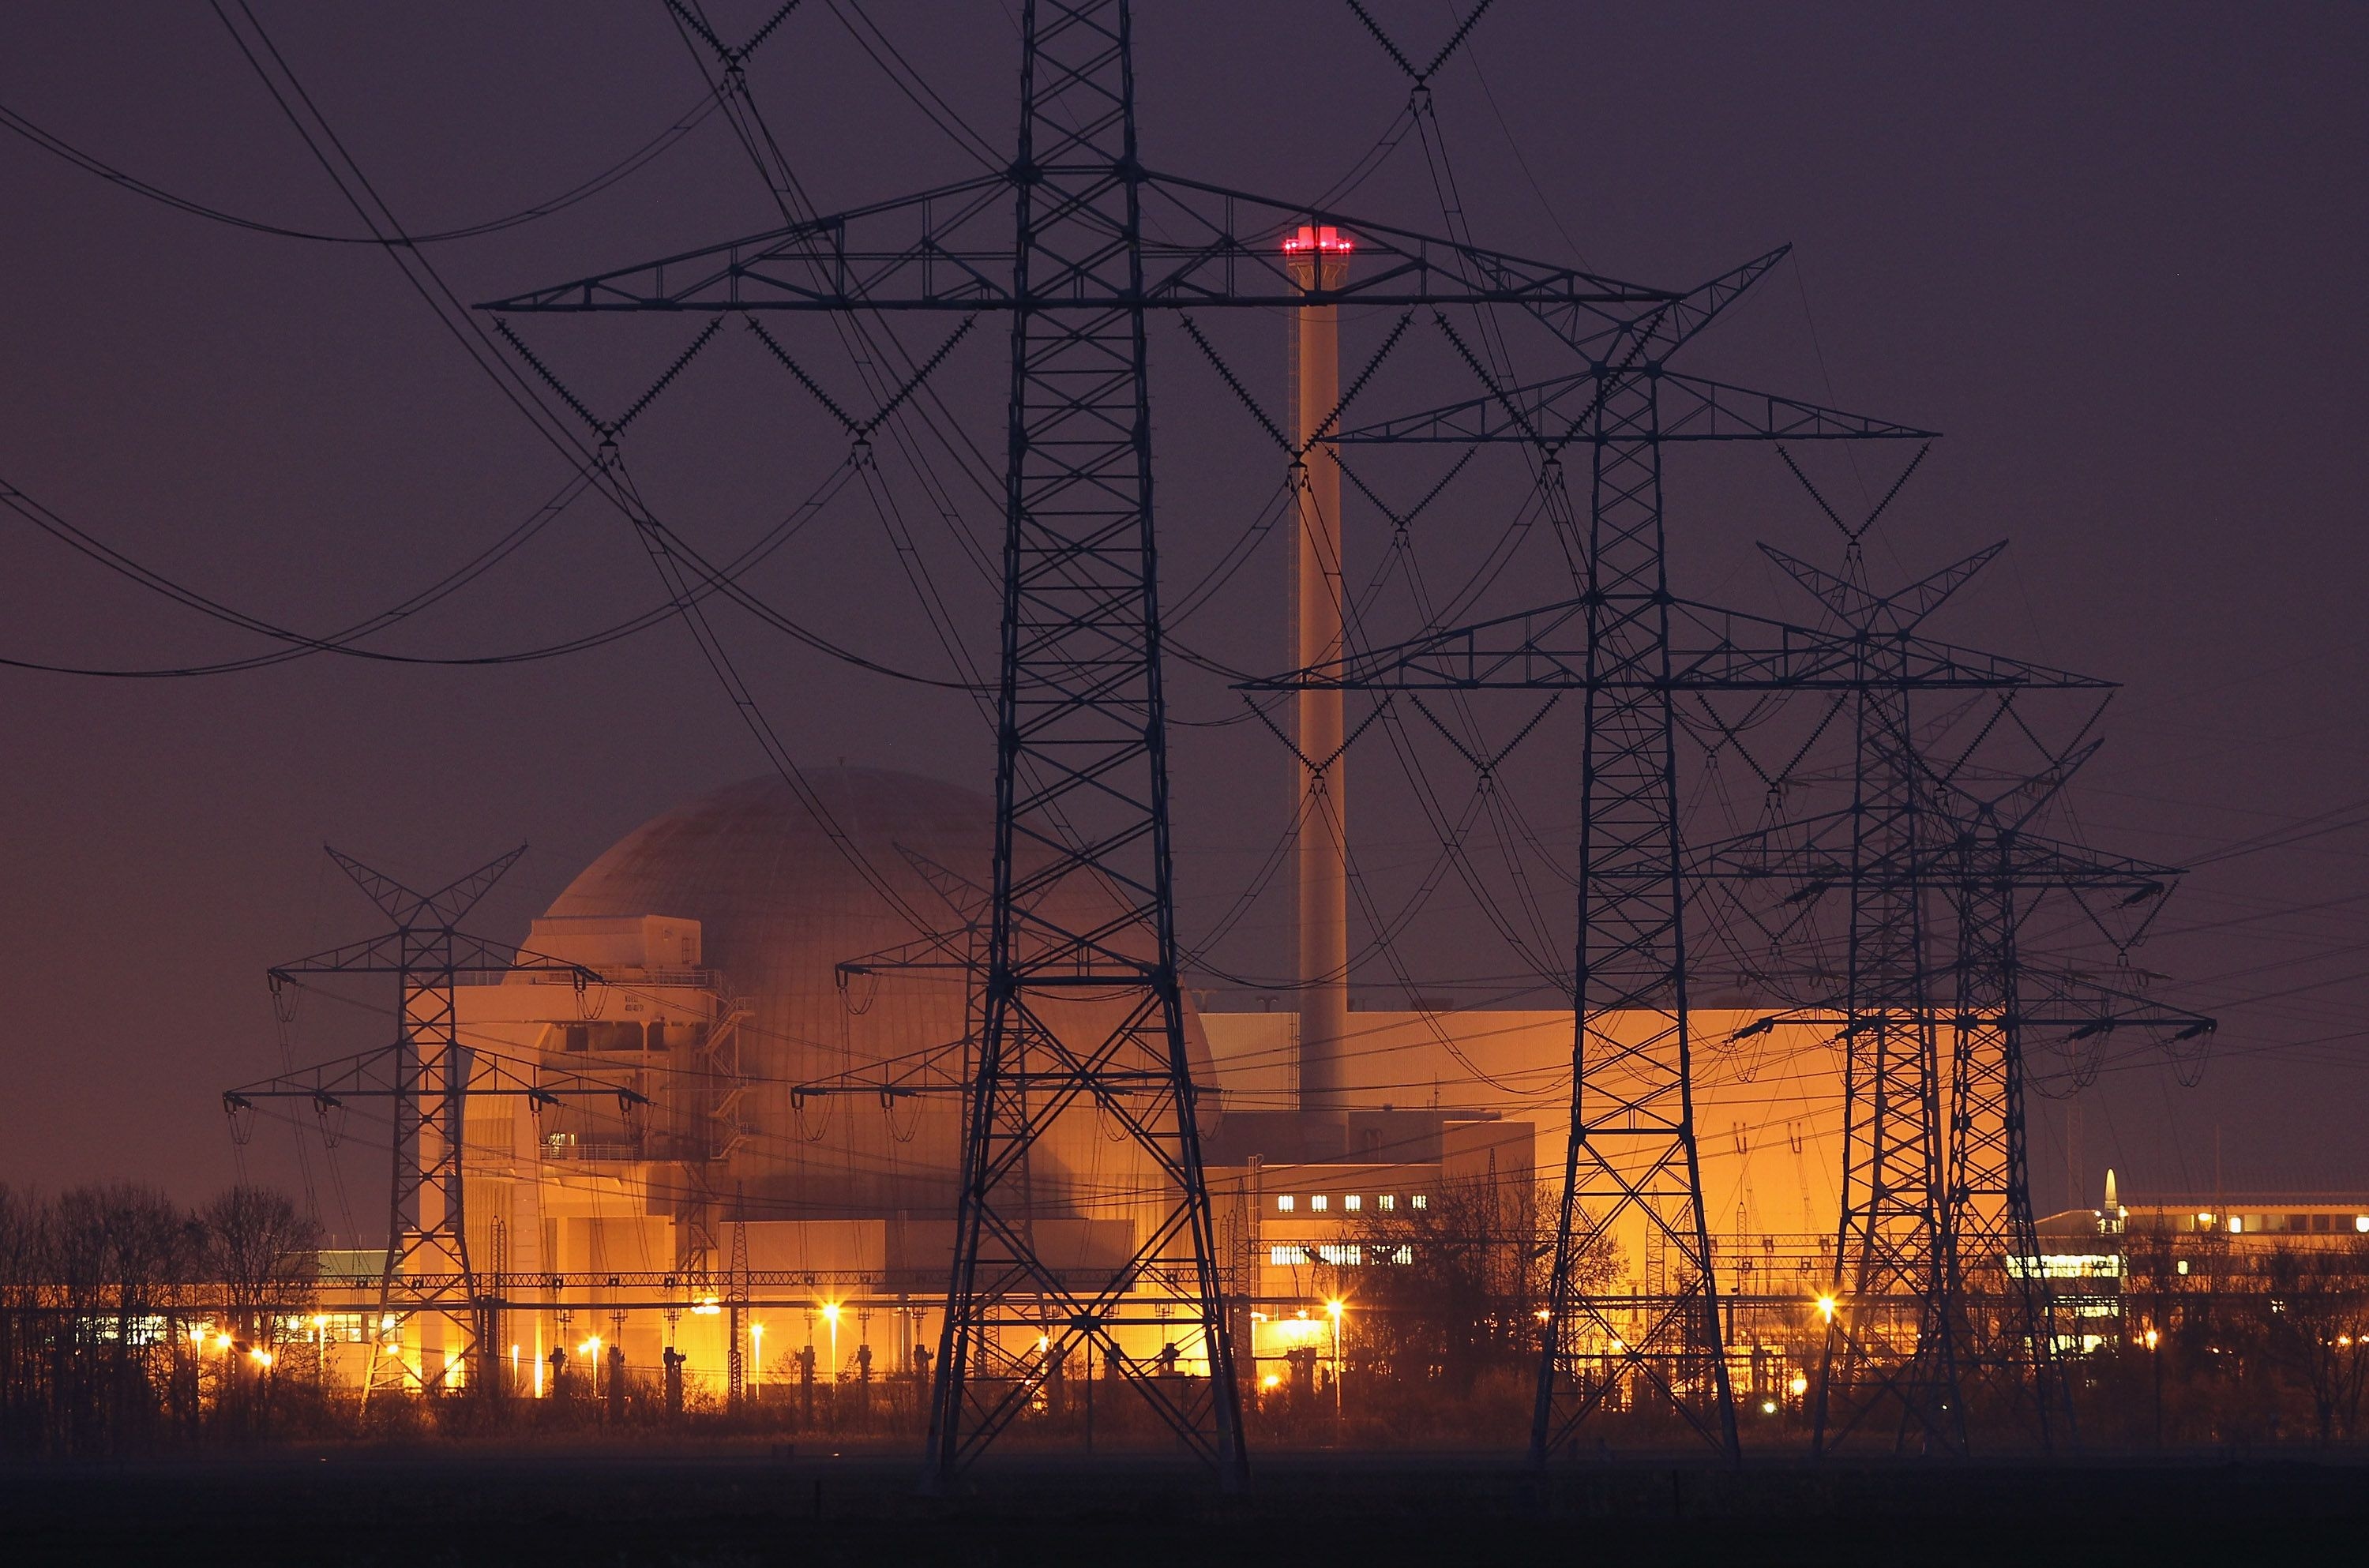
Image Credits: Electricity Maps
Electricity Maps aggregates real-time data for electricity production in more than 50 countries around the world. While the company uses open-data sources, employees and community contributors had to build dozens of parsers to standardize this data.
As renewable energy depends on weather conditions (for wind and solar energy in particular), the mix of energy sources constantly evolves. It means that the carbon intensity of the energy produced also changes with the time of the day and the current conditions. And, as you may have guessed, as electricity works a bit like tap water flowing through a vast network of tubes, the CO2 emissions related to the electricity you consume can vary greatly.
Calculating the CO2 emissions can be complicated, as there are also a lot of cross-border flows for electricity — some countries produce more electricity than they actually consume while others have larger electricity needs than production capacity. Electricity Maps has designed its own flow-tracing model to understand which power plant contributes to the electricity you’re consuming right now.
“We’re going to process all this in our system with what we call a flow-tracing algorithm, which lets us tell you where the electricity is coming from depending on where you are. It can be produced locally, but it can also come from Germany. But Germany imports from Poland, so it could potentially come from Poland, etc. So we need to perform some modelling,” Corradi said.
The company also stores historical data and uses machine learning algorithms to provide 24-hour forecasts. Just like weather APIs are now a big industry, electricity forecasting APIs could become essential business tools in the future.

Electricity Maps founder and CEO Olivier Corradi. Image Credits: Electricity Maps
From carbon intensity to load shifting
The reason why the open source data visualization project is an essential part of the company is because Electricity Maps wants to achieve as much consensus as possible. Calculating the life cycle emissions for electricity generation requires peer-reviewed studies.
The company shares all its sources for emission factors. It also means that these calculation methods can evolve over time as researchers release new studies with more accurate results. The community can discuss and submit potential changes that will be reflected in Electricity Maps’ data.
As for the commercial part, being able to know the carbon intensity of the electricity that is available at a specific place and a specific time can be a sort of superpower.
“With all the renewable energy installation goals, we’re going to find ourselves in a world where the quantity of intermittent renewable energy will triple by 2030,” Corradi said.
“The good thing is that this demand is flexible because it’s going to be electric cars and you can change the time at which they charge. It’s going to be AI training and you can choose the time at which you’re going to train these big models,” he added.
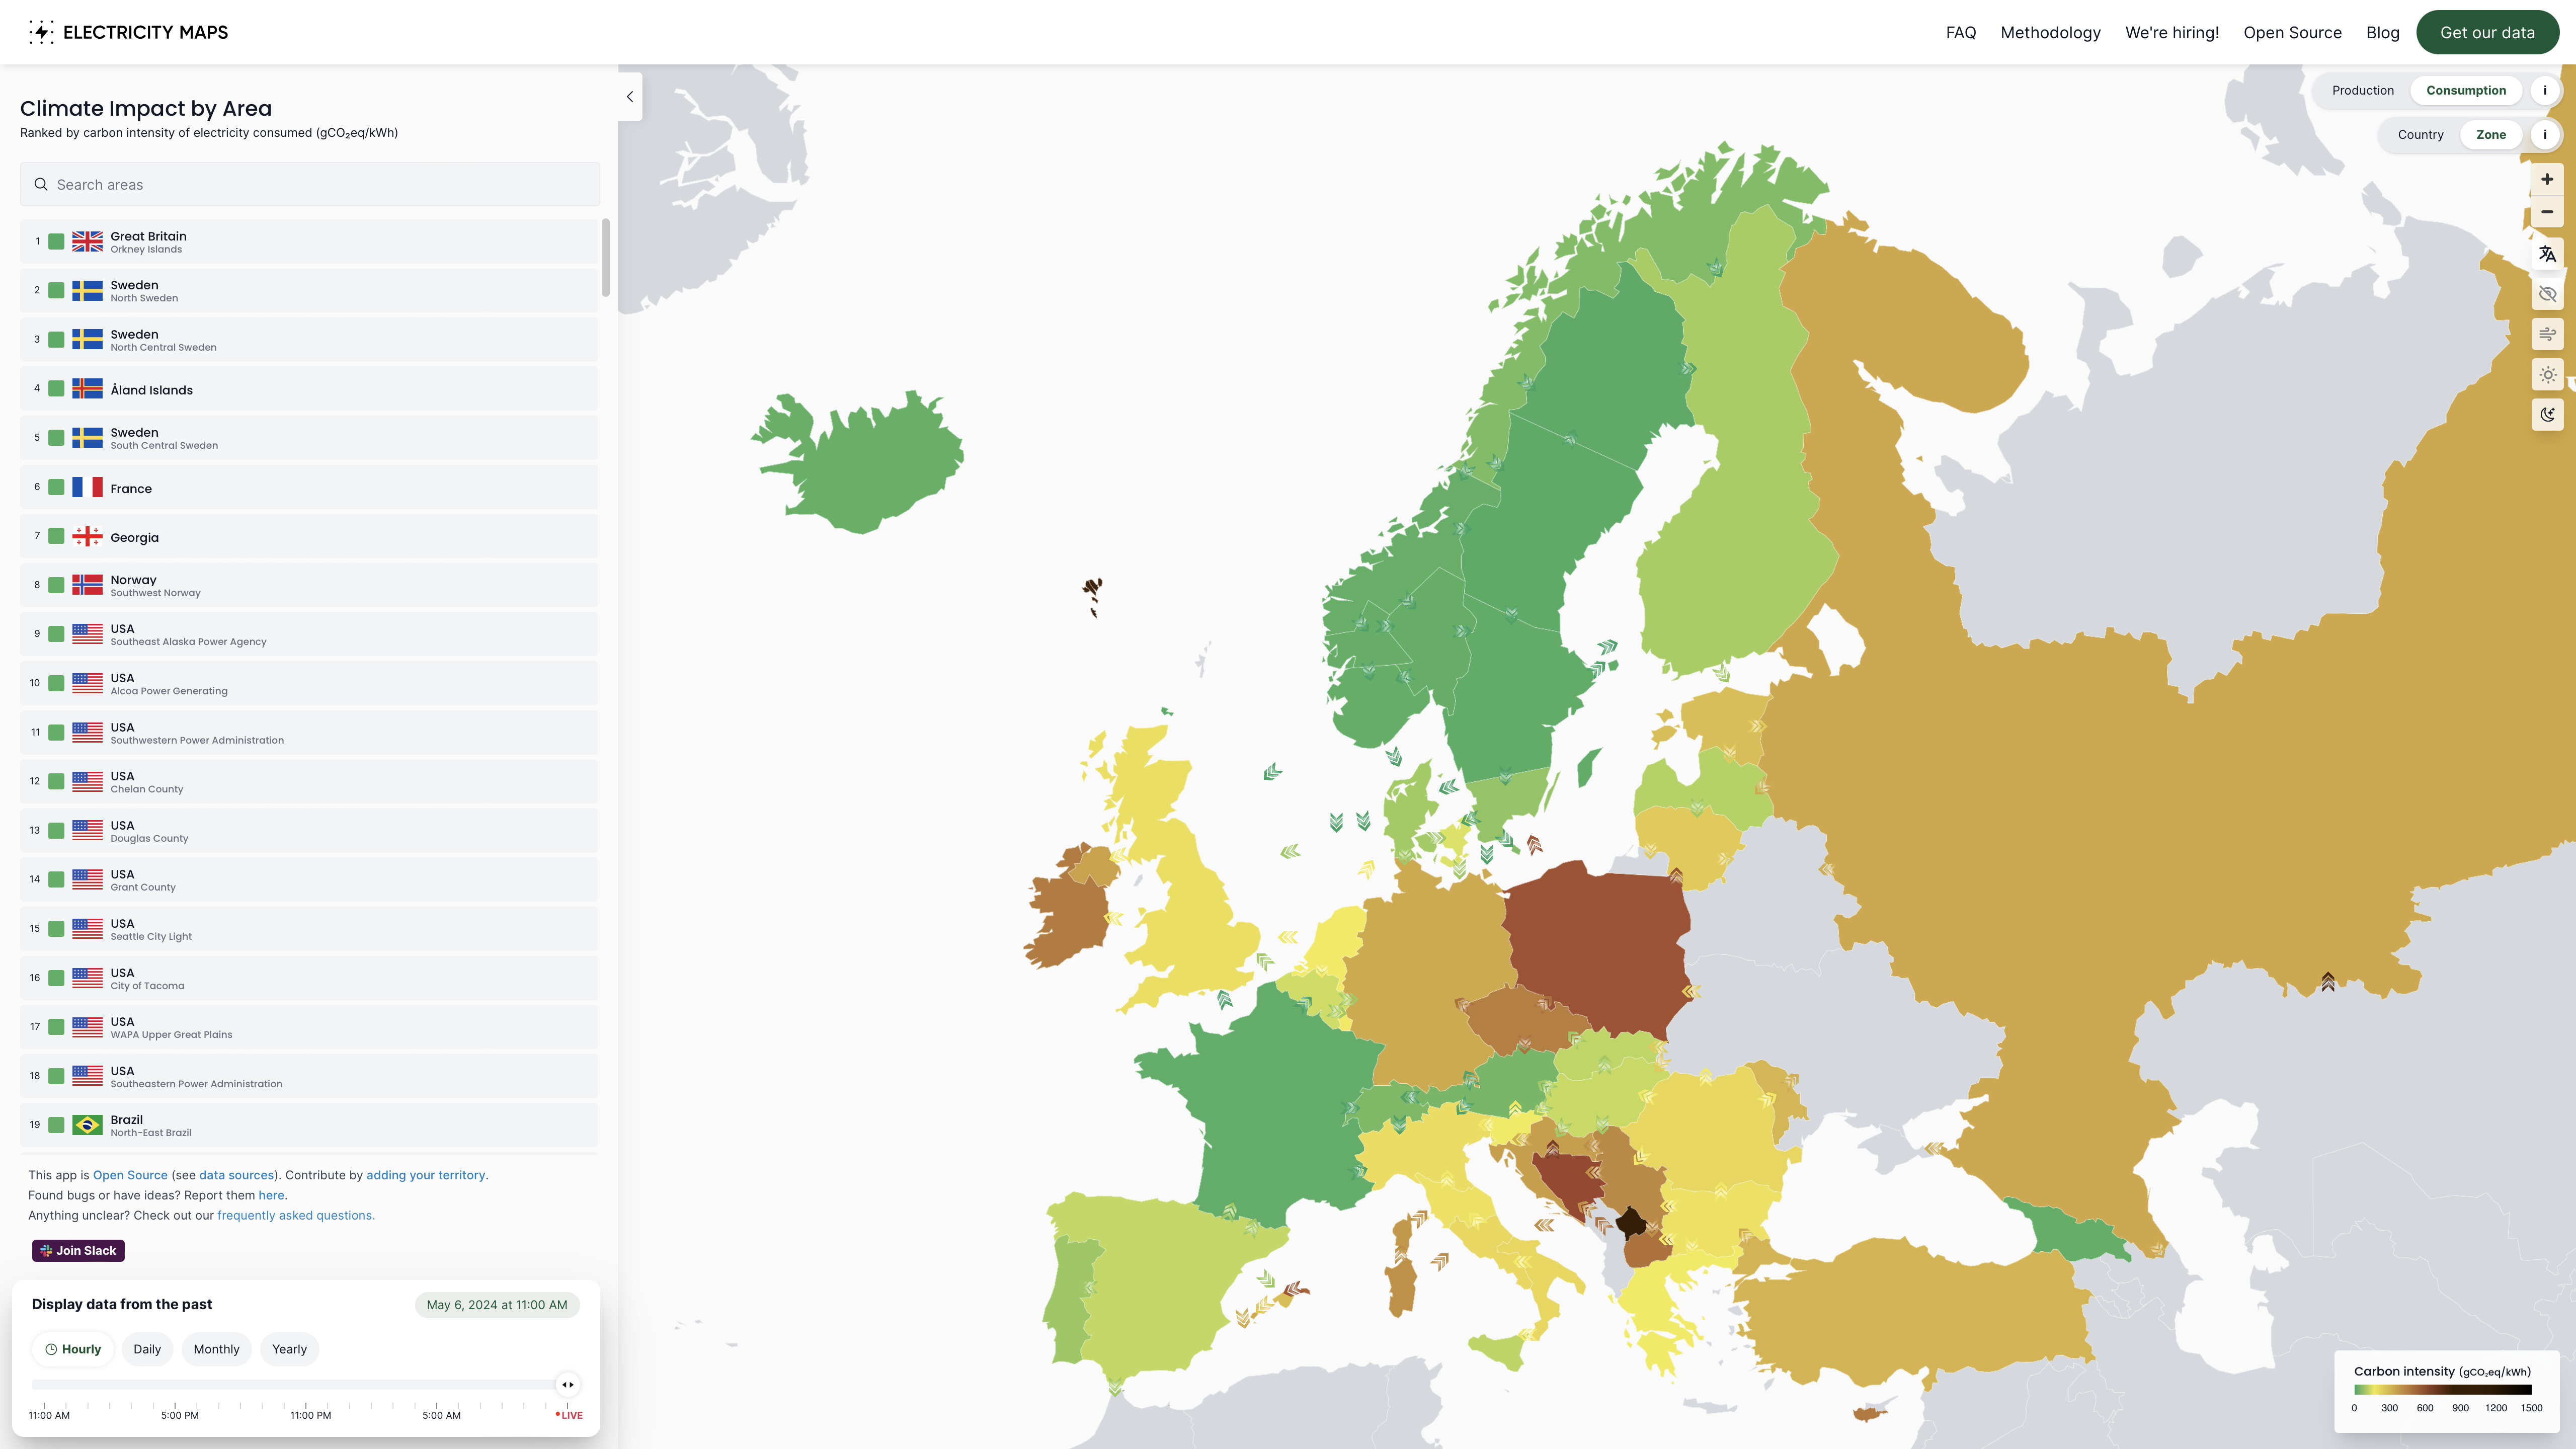
Image Credits: Electricity Maps
Google, one of Electricity Maps’ most important clients, partnered with the European startup to calculate the carbon intensity of the electricity powering its data centers.
For some tasks, such as indexing the web or training a new AI model, Google can use Electricity Maps’ data for load shifting. When there’s more wind, it’s time to boot up additional servers. Or when it’s nighttime in the U.S., Google can move some compute-intensive operations to European data centers.
But Google’s own clients will also benefit from the company’s partnership with Electricity Maps. With the EU’s Corporate Sustainability Reporting Directive, many companies will soon have to publish carbon accounting reports. As many companies rely on Google Cloud for their hosting needs, they will need data to calculate their scope 3 emissions. Thanks to Electricity Maps’ historical data, that carbon data will be more accurate.
Samsung, another client for Electricity Maps, uses the startup’s data to show users the electricity usage and carbon footprint of their Samsung devices. In that case, this is more about educating users.
But Electricity Maps is much more than an educational tool. It can act as the information layer that decides whether it’s a good time to turn on millions of electric devices — or, at least, if it’s a good time to have as little impact as possible on the planet.
Why is a profitable company raising? The funding injection is aimed at dialing up Electricity Maps’ own impact by stepping on the gas so it can meet rising demand for smarter climate tools, per Corradi. “The reason we raised is simply that the amount of renewable energy now in the system is starting to be so significant that you’re starting to have an opportunity to activate the flexibility of the appliances you have at home, or in the industrial sector.”

We would love to hear more about your project
Subscribe Newsletter
Please subscribe to our Newsletter to get the latest updates.